Welcome to Microsoft Excel
Watch this brief introduction to the course
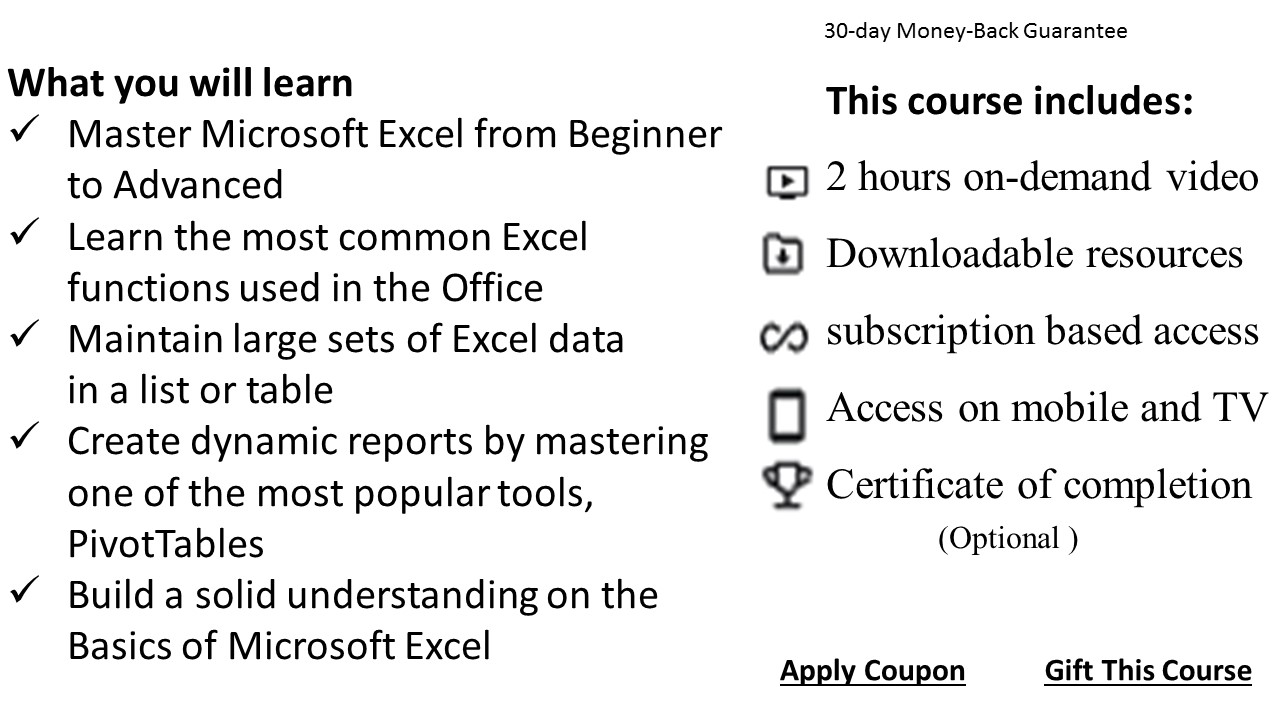
About the course
In this Excel tutorial, you will learn all the tips, tricks, shortcuts, functions and formulas you need to be an Excel power user. This Excel course is designed specifically for spreadsheet users who are already performing professionally and are looking to prep for Excel Crash Course. We believe it is important to start at the bottom and build a solid base, which is why we review all the foundational skills you need before building more advanced spreadsheets. In this Excel tutorial, you will learn to leave behind the mouse and use keyboard shortcuts to dramatically improve and speed up your spreadsheet building skills.
What's in the course
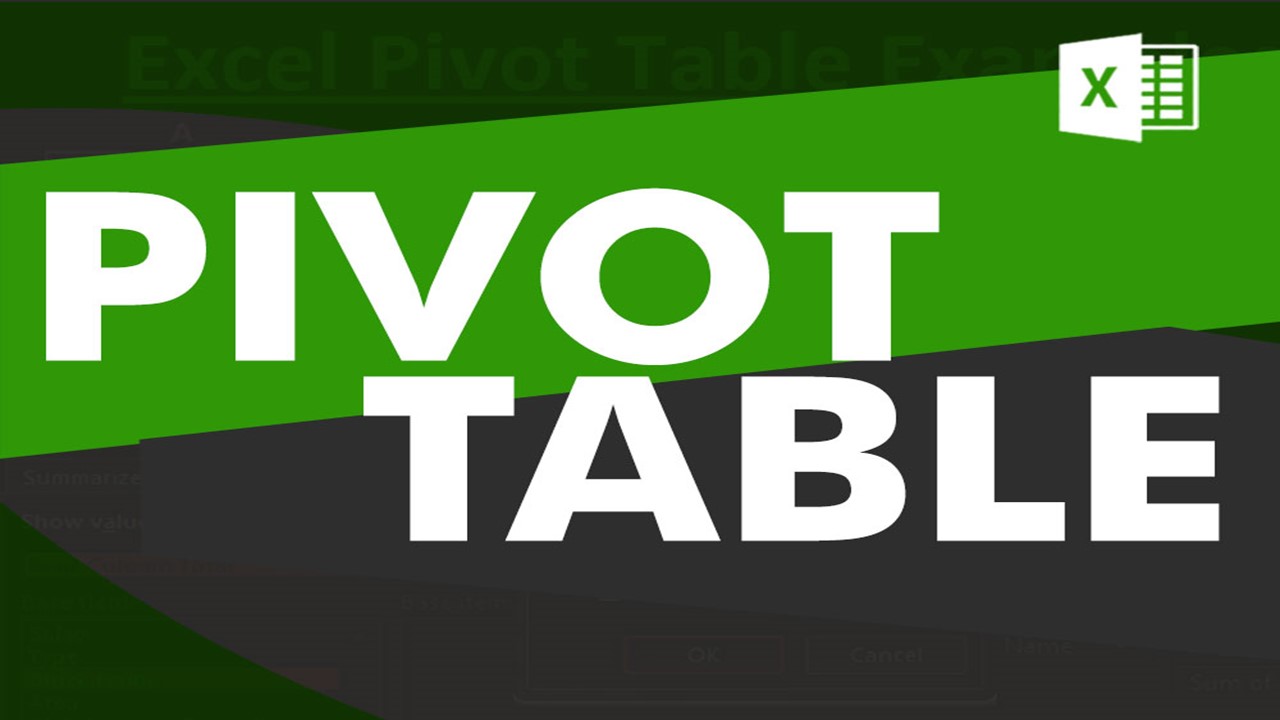
How to create a Pivot Table
A pivot table is a table of statistics that summarizes the data of a more extensive table (such as from a database, spreadsheet, or business intelligence program). Pivot tables are a technique in data processing. They arrange and rearrange (or "pivot") statistics in order to draw attention to useful information. This leads to finding figures and facts quickly making them integral to data analysis.
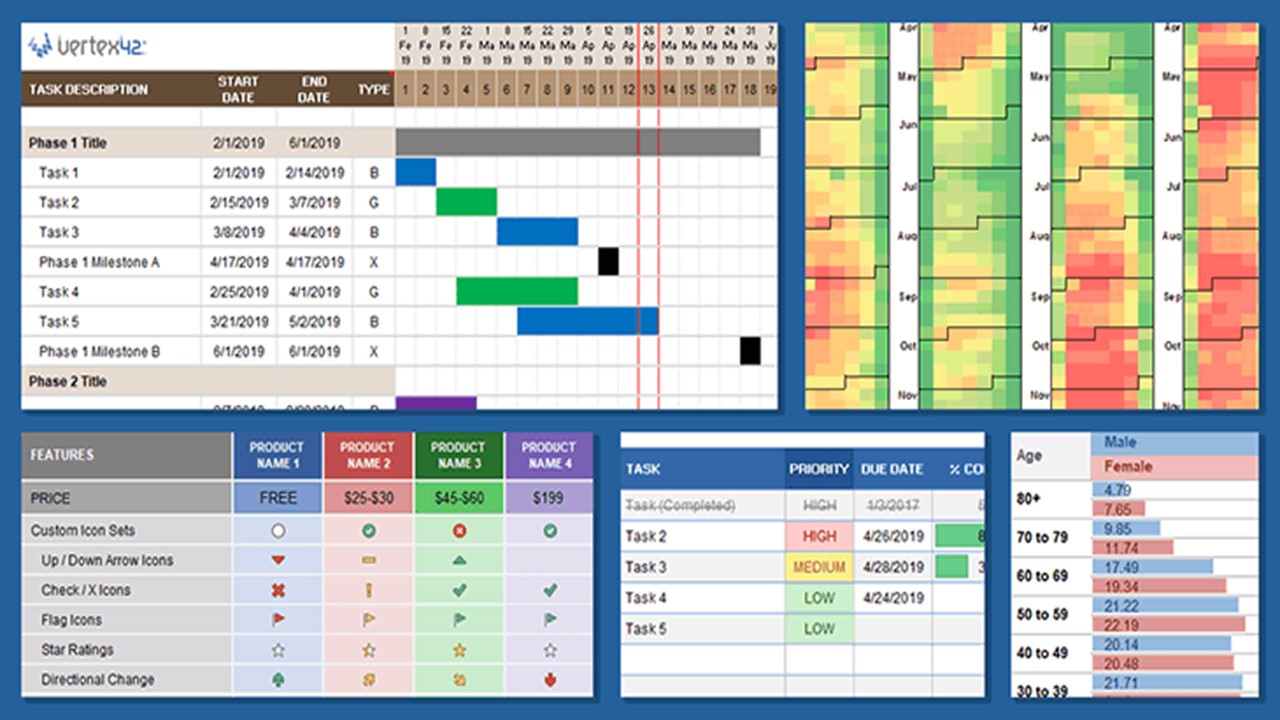
Conditional Formatting
Conditional formatting is a feature included in the popular spreadsheet creation programs Excel and Google Sheets. This feature automatically applies formatting, such as font color or bolding, to a cell when the data in that cell meets specific criteria. For example, in the image, the font color is automatically changed to red in all cells with negative values.
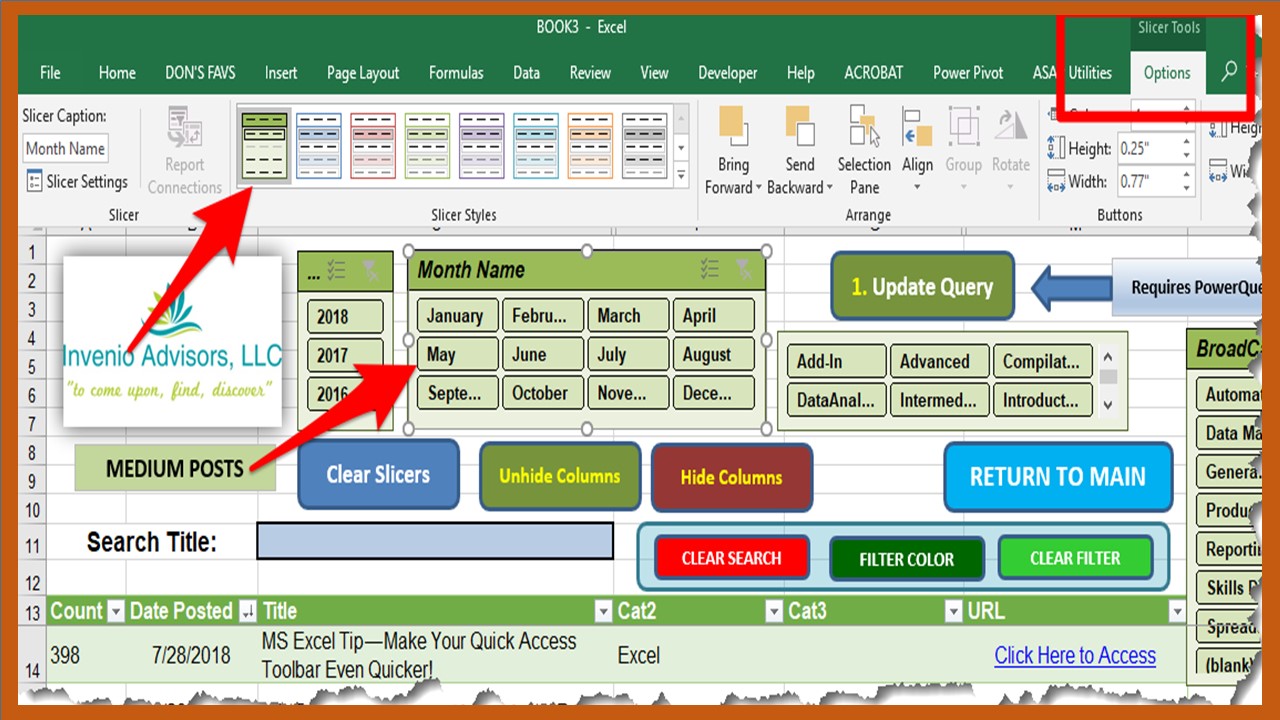
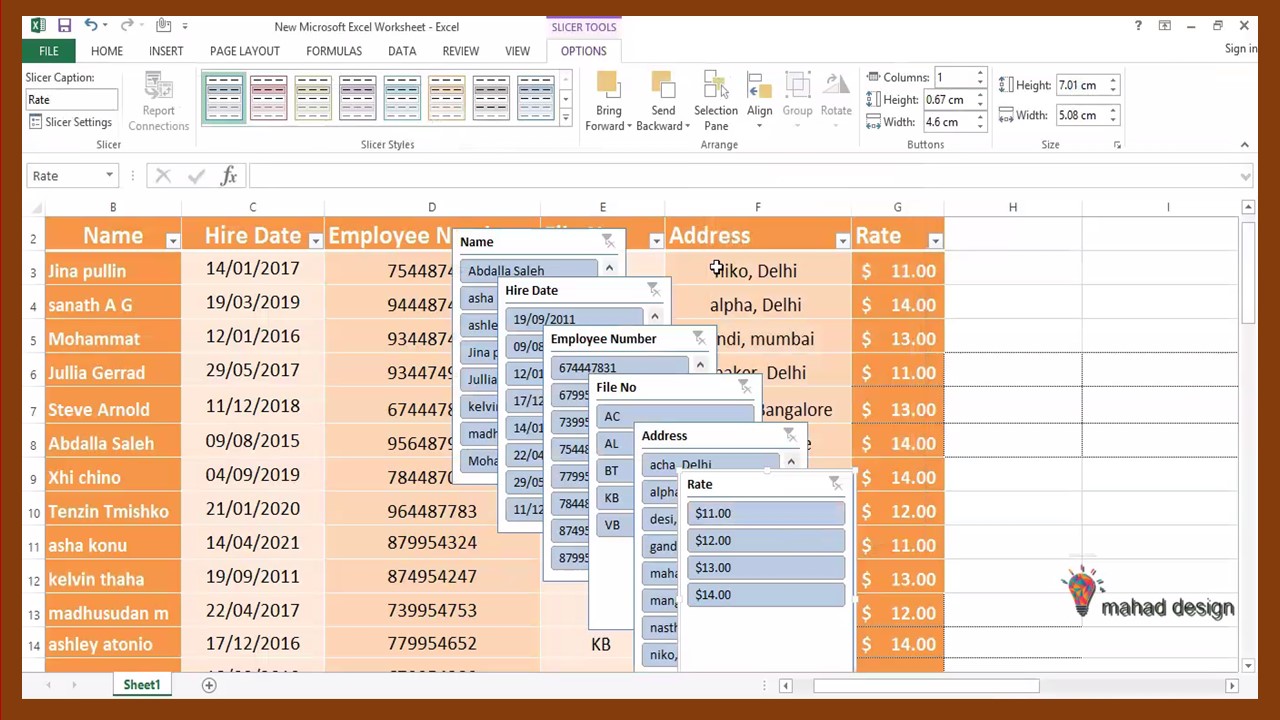
How To Insert a Slicer
A Slicer is an interactive control. A Slicer makes your job easy to filter data in a pivot table. Filtering with Slicers can be done by using the field labels in the pivot table, but Slicers are targeted for those who might not understand how to filter data in a pivot table. You can also use Slicers to create an attractive and easy-to-use interactive “dashboard”